Ultimate Tools for Bitcoin Price Chart Analysis
With the cryptocurrency market continually evolving, the need for effective Bitcoin price chart analysis tools has never been more critical. Investors aim to navigate price volatility while making data-driven decisions. Understanding market trends through proficient chart analysis can significantly enhance trading strategies. But what are the best tools available, and how can they improve your investment outcomes?
Why Bitcoin Price Chart Analysis Matters
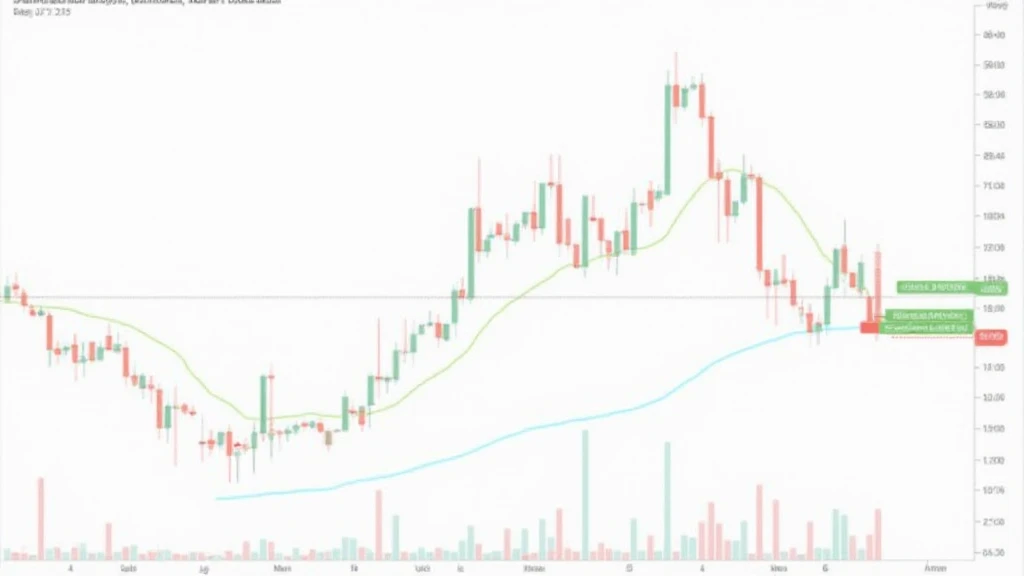
Bitcoin’s value fluctuates rapidly. According to recent data, the price of Bitcoin experienced a staggering increase of over 300% in a year and a subsequent drop by 50% in just a few months (source: CoinMarketCap). Such volatility poses immense challenges for both novice and experienced traders. Having access to precise analysis tools is akin to having a financial compass in a stormy sea.
Understanding the Bitcoin price chart helps traders identify market trends, support and resistance levels, as well as potential reversal points. With tools that allow you to visualize these aspects, you can refine your entry and exit strategies, thereby enhancing your potential for profitability.

Key Features to Look for in Bitcoin Price Chart Analysis Tools
When searching for Bitcoin price chart analysis tools, keep an eye out for the following features:
- Real-time Data: An essential element for timely decision-making.
- User-Friendly Interface: Simplifies navigation and understanding of complex data.
- Technical Indicators: Tools like Moving Averages, RSI, and Bollinger Bands to predict trends.
- Customization Options: Tailor the charts according to your trading style.
- Mobile Compatibility: Ability to analyze charts on the go.
Top Bitcoin Price Chart Analysis Tools
Let’s break down some of the most reputable Bitcoin price chart analysis tools that cater to various needs:
1. TradingView
TradingView is widely recognized for its user-friendly interface and comprehensive technical analysis capabilities. Offering a range of charting options and technical indicators, it allows traders to analyze price movements effectively. TradingView’s social community feature also enables users to share ideas, making it invaluable for both learning and collaboration.
2. Coinigy
With Coinigy, you can track Bitcoin and other cryptocurrencies across exchanges with real-time price data and alerts. The platform supports a variety of technical indicators, enabling traders to attain deeper insights into price movements.
3. CryptoCompare
CryptoCompare provides detailed statistics and analytics on Bitcoin and other cryptocurrencies. It offers customizable chart options, expert analysis, and integrated news feeds, making it a comprehensive resource for traders.
4. CoinMarketCap
Famous for its extensive market cap listings and historical price data, CoinMarketCap is an excellent tool for Bitcoin analysis. It includes interactive charts that allow users to visualize price history, trading volume, and market cap.
5. Binance Charting Tools
For those trading on Binance, its integrated charting tools provide real-time data, analytical indicators, and support for multiple order types. It’s particularly useful for frequent traders who wish to combine trading and analysis on one platform.
Utilizing Bitcoin Price Chart Analysis Tools for Market Prediction
Using graphical representations of Bitcoin’s price can reveal patterns and formations that indicate future price movements. Here’s how you can employ these tools to predict price movements:
- Analyzing Historical Data: Understanding previous price movements helps predict future trends.
- Identifying Patterns: Recognizing formations like head and shoulders or triangles can forecast market direction.
- Setting Alerts: Use alerts to notify you of significant price changes, enabling timely responses.
- Risk Management: Utilizing stop-loss orders based on technical analysis can protect against market downturns.
Real-World Applications: A Case Study
In October 2023, Bitcoin saw an unexpected surge past $60,000. As demonstrated in the price analysis chart:
| Date | Price ($) |
|---|---|
| 2023-10-01 | 54,000 |
| 2023-10-10 | 57,500 |
| 2023-10-15 | 59,000 |
| 2023-10-20 | 62,000 |
Traders utilizing these tools accurately identified bullish momentum signs and were able to capitalize on the rising prices.
Adapting to the Vietnamese Market
As the cryptocurrency landscape continues to evolve, Vietnam is seeing impressive growth in the number of crypto users. Data indicates a growth rate of approximately 43% in 2023. This rapid increase emphasizes the importance of understanding Bitcoin price chart analysis tools in a market that is swiftly developing.
Incorporating concepts such as tiêu chuẩn an ninh blockchain (blockchain security standards) not only enhances users’ comprehension of the tools but also improves their overall investment strategies in a booming market.
Conclusion
With the volatility and unpredictability of Bitcoin prices, utilizing effective Bitcoin price chart analysis tools is essential for traders looking to navigate this complex market. From TradingView to Binance’s charting options, a plethora of resources are available. Emphasizing data-driven strategies will undoubtedly enhance your ability to foresee market trends and ultimately increase profitability.
As the market matures, continuous learning and adapting will remain pivotal. Keep honing your skills in analyzing the Bitcoin price chart, and you’ll position yourself for success in this dynamic space.
For those looking to delve deeper into cryptocurrency strategies, visit cryptosalaryincubator for more insights and resources.
Author: Dr. John Smith, a recognized expert in blockchain technology with over 15 published studies in cryptocurrency trading strategies and significant involvement in several high-profile crypto audits.


